Turns out that Alex Kerin has made a fabulous Excel spreadsheet for converting data into unicode blocks that can form a "sparkbar".
It ain't perfect, but it's a step forward, right?
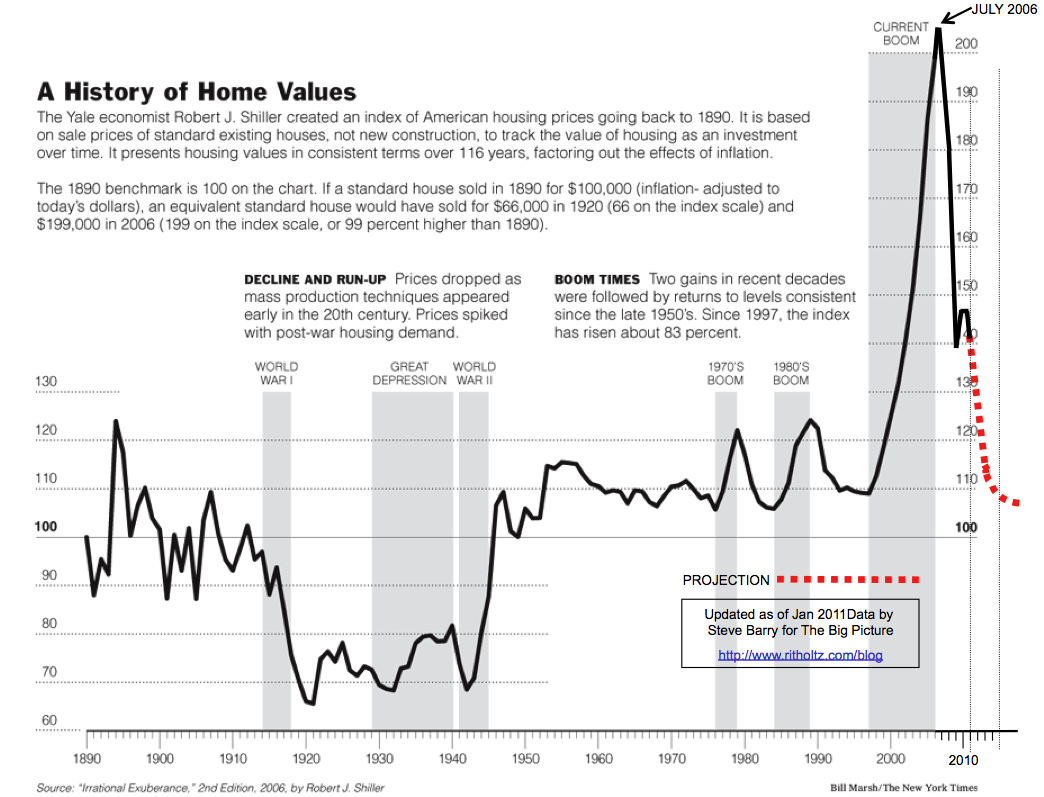
To create the sparkbar, I took the data from Robert Shiller's page, computed the average value per decade using Excel trickery, and then lowered all the numbers so that the minimum value was zero.
Final result: ▃▂▂ ▁▁▄▃▄▄▄█▅
What do you think? Is this useful?

